Food Recognition
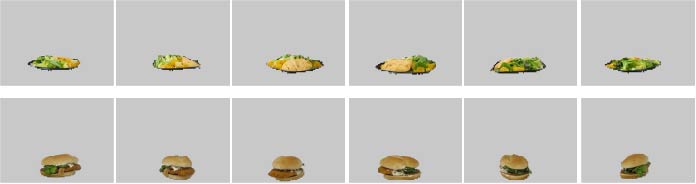
Pittsburgh Food Image Dataset(PFID) is a recently released food dataset. The PFID dataset is a collection of fast food images and videos from 13 chain restaurants acquired under lab and realistic settings. Like the paper [15], we focus on the set of 61 categories of specific food items(e.g. McDonald's Big Mac) with masked background. Each food category consists of three different instances of the food (bought on different days from different branches of the restaurant chain), with six images from six viewpoints for each food instance. The figure below shows some samples.
Experiments on 61 Categories
Following the standard experimental protocol proposed by Chen et al. [30] and perform 3-fold cross-validation for our experiments, using 12 images from two instance for training and 6 images from the third part for testing. The averaged results are reported. The protocol ensures that no images of any given food item ever appears in both the training and test sets. In this paper, we strictly follow the experimental setups of [15].In this paper, we compare PRI-CoLBPg with two baseline algorithms and some related methods proposed in [15]. The two standard baseline algorithms are color histogram + SVM and bag of SIFT features + SVM. We also list the experimental results of these two baseline algorithm reported in [15]. In [15], some features for food recognition are described by exploiting the spatial relationship among different ingredients (such as meat and bread in a sandwich). The food items are represented by pairwise co-occurrence statistics between local features of the different ingredients of the food items.
Experimental Analysis:
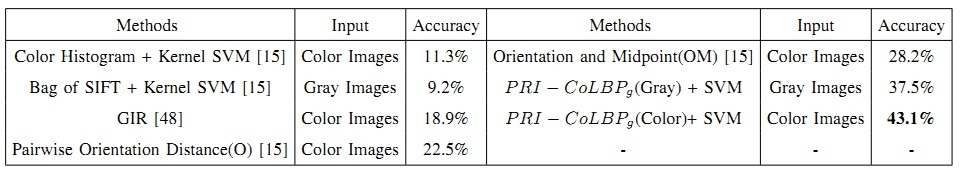
The table shows the classification accuracy on 61 categories. The first five results are taken from [15], where GIR means the global ingredient representation [48].
The chance recognition rate for 61 categories is below 2%(1/61). Traditional bag-of-sift with kernel SVM achieves 9.2%. Color histogram with kernel SVM obtains 11.3%. The GIR global ingredient histogram method achieves 19%, and the performances of local pairwise features range from 19% to 28%. The best performance achieved by [15] is 28.2% by using orientation and midpoint category joint pairwise features. With same classification method as [15], our method achieves 37.5% accuracy on the gray images and 43.1% accuracy on the color images.
Compared with [15], PRI-CoLBPg doesn't need the preprocessing. In [15], they use Semantic Texton Forests(STF) [48] to create pixel-wise soft labels for the images, and then the created pixel-wise labels are used to make pairwise statistics between different ingredients of the food items. Thus, their methods greatly depend on the accuracy of soft ingredients labeling of pixels. Furthermore, The dimensions of their used features are proportional to N2, where N is the number of the ingredient categories. The feature dimension of [15] is 6144, but the dimension of our PRI-CoLBPg for food recognition is 1180*3=3560.
The biggest challenging for PFID is that the training data is from two different days with 6 images per day, but the testing data is from another day. The 6 images in same day are captured on just one entity under 6 different viewpoints. Thus, the true training data for each categories is limited to 2 entities. So the training and testing condition is harsh. It requires that the used feature should have great generalization ability. Although, PRI-CoLBPg outperforms the state-of-the-art methods more than 10\%. It should be noted that for all 61 categories, almost 20 categories have classification accuracy of zero.
The overall low accuracy on 61 categories is due to two aspects. First, many foods with similar appearances and similar ingredients are assigned to different categories in the PFID dataset. Second, the training and testing data are acquired in different days and the training data has strong viewpoint change.
Experiments on Seven Major Groups
In this paper, in order to investigate the effect of the first aspect, following [15], we split 61 PFID food categories into seven major groups - sandwiches, salads/sides, chicken, breads/pastries, donuts, bagels, and tacos. Then, we test the proposed feature on the modified dataset. The classification accuracy is shown below.
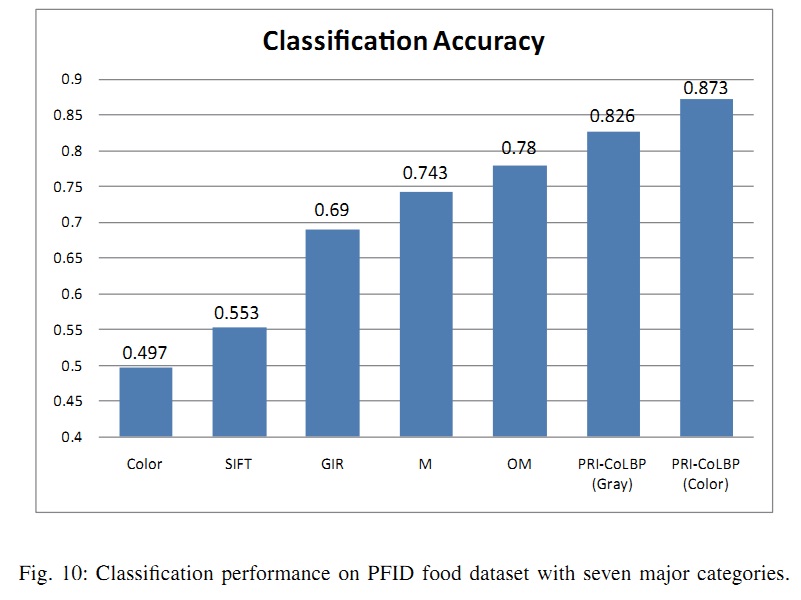
The average chance classification accuracy is 14.3%. Color histogram with kernel SVM gets 49.7%, and bag-of-sift with kernel gets 55.3%. With same kernel SVM method, PRI-CoLBPg obtains 87.3%, which outperforms traditional bag-of-SIFT feature for about 32%. Meanwhile, PRI-CoLBPg also exceeds the best result of [15] for 9.3%. It should be noted that in order to fair comparison with [15], we use same evaluation measure as [15] which is The correct test number / The total test number. We also compute the average class accuracy, the best result of [15] is 64.29% and our PRI-CoLBPg is 74.96%.
Acknowledgments
Thanks Shuling Yang for providing some experimental details and some training configuration data.References
[15] S. Yang, M. Chen, D. Pomerleau, and R. Sukthankar, “Food recognition using statistics of pairwise local features,” CVPR, 2010.[30] M. Chen, K. Dhingra, W. Wu, L. Yang, R. Sukthankar, and J. Yang, “Pfid: Pittsburgh fast-food image dataset,” ICIP, 2009.
[48] J. Shotton, M. Johnson, and R. Cipolla, “Semantic texton forests for image categorization and segmentation,” CVPR, 2008.